This report was produced with sample data. The brand (Northwind Leather), the competitors, the sites and the numbers are fictional; it is not the result of a real measurement. The report itself comes from the dashboard's real report screen (1 October 2026).
What does the first page of the report say?
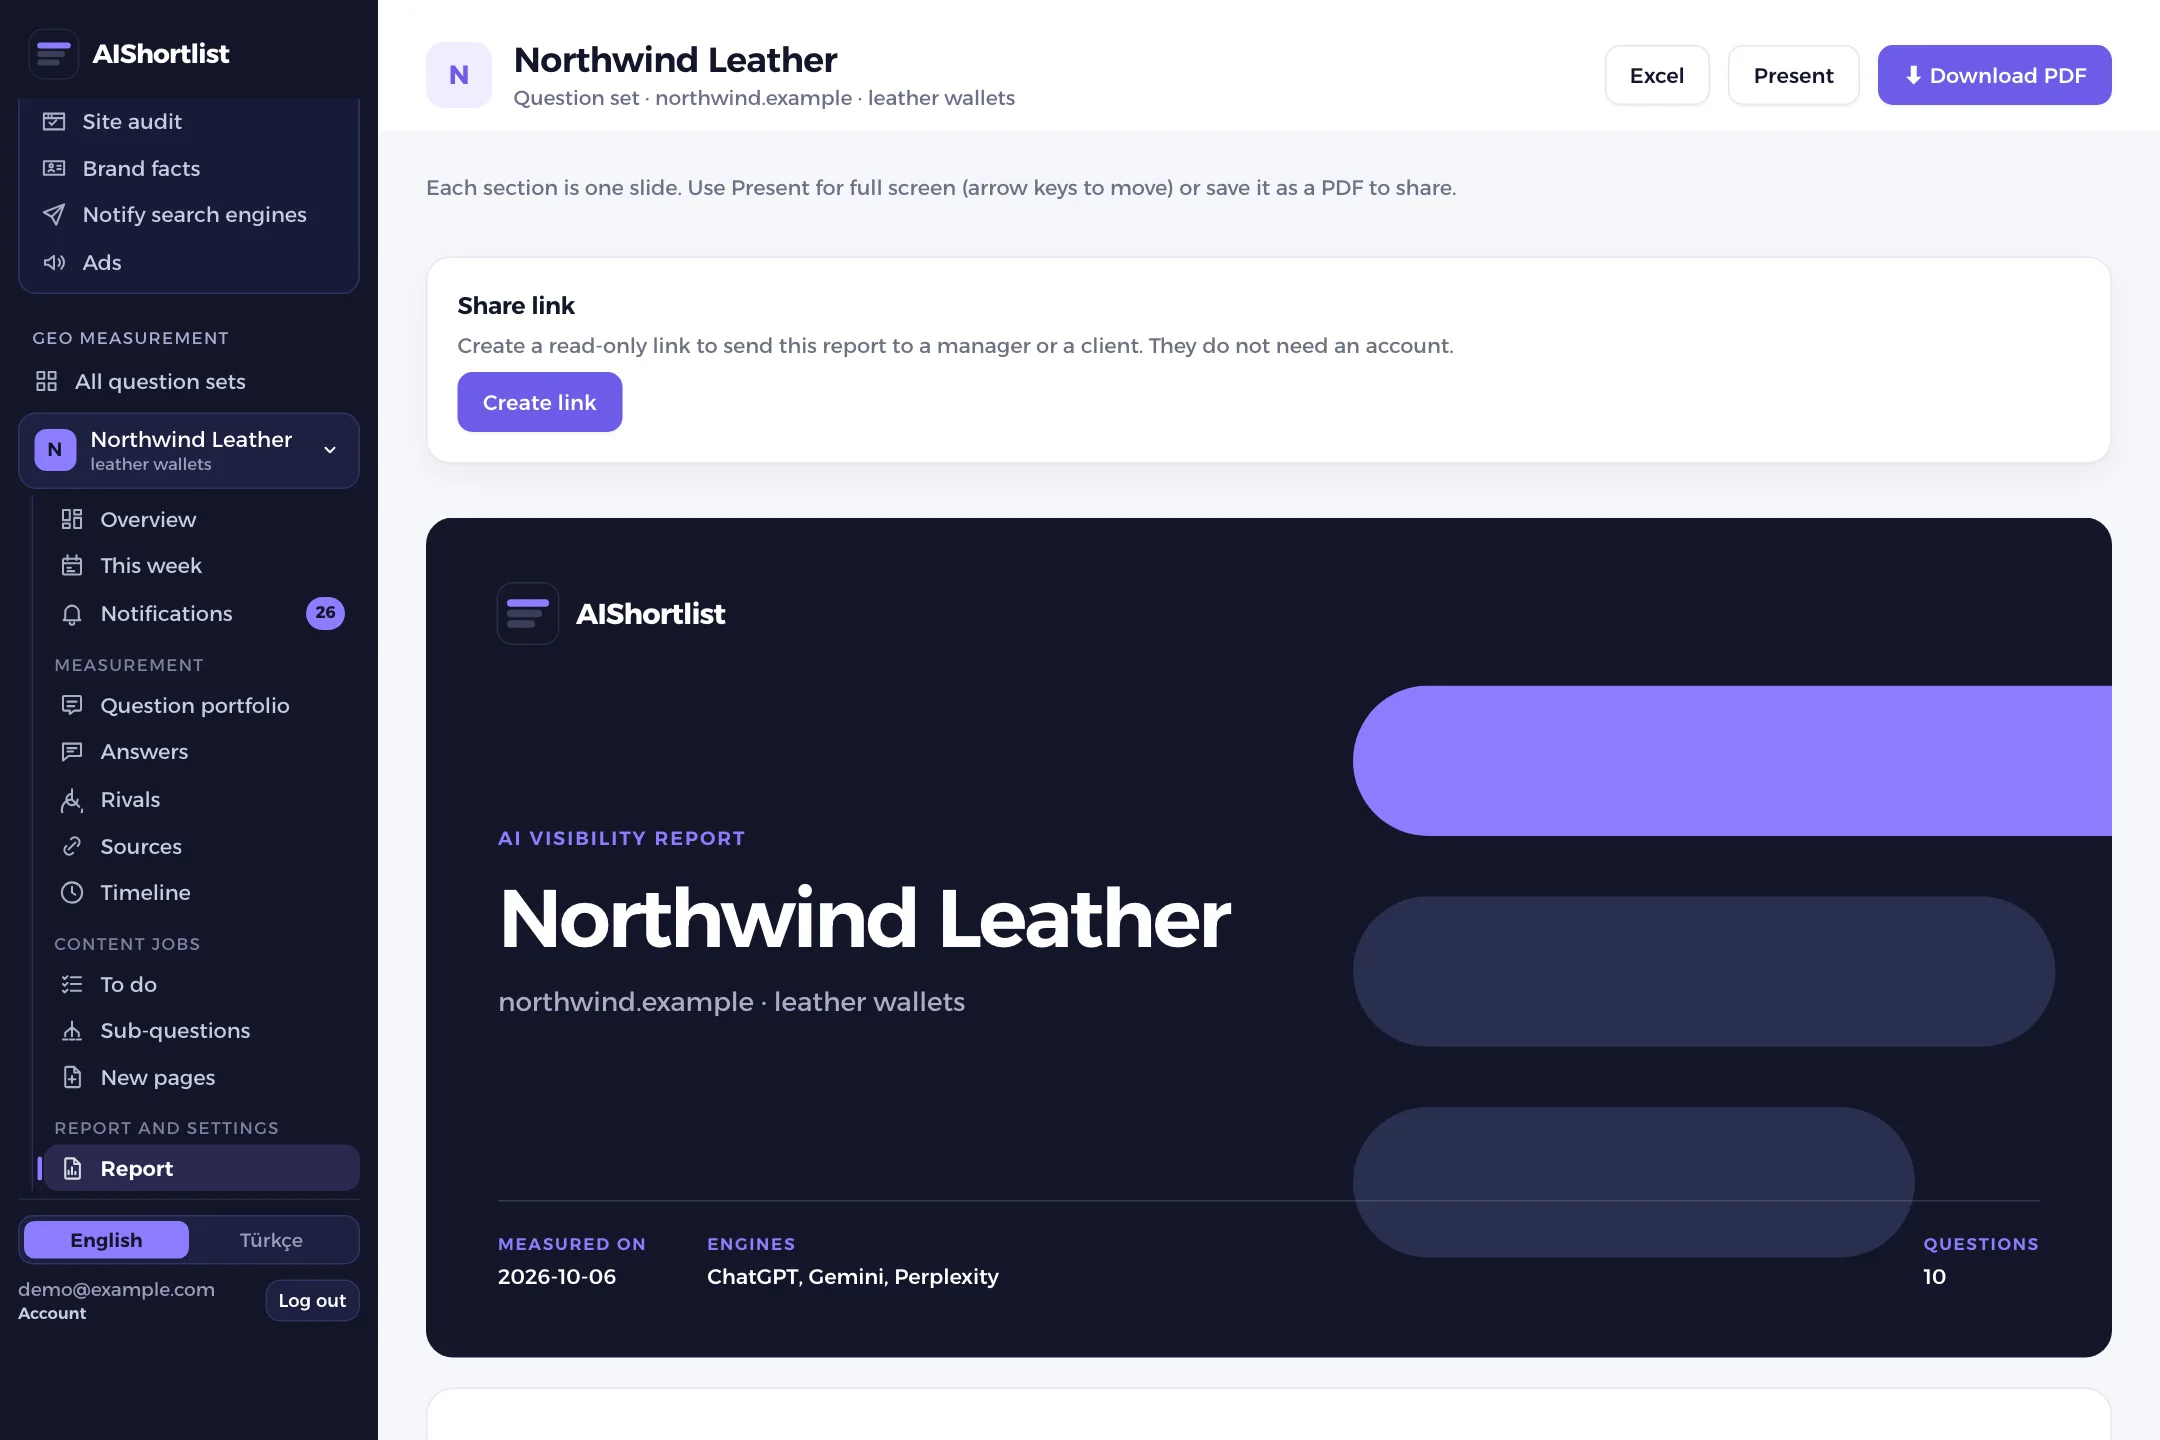
The cover shows the brand, the domain, the measurement date, the engines measured and the number of questions. The summary page gives four numbers and turns them into sentences.
| Number | Value in the sample | Meaning |
|---|---|---|
| AI visibility score | 50% | Named in 15 of 30 answers (10 questions, 3 engines) |
| Share of voice | 13.3% | Share of all brand mentions in the answers |
| Rank among brands | #4 | Place among the most mentioned brands |
| List pages where the brand is missing | 5 | Pages the answers cite that do not include the brand |
The sentences under the summary turn the numbers into a reading: ChatGPT names the brand most often (80% of its answers), Gemini least (20%), and 1 of the 10 questions never names it.
How are competitors and questions shown?
The competitor ranking lists the most mentioned brands with their mention counts, and you see your own place in the same list. In the sample the top brand has 17 mentions and Northwind Leather has 15.
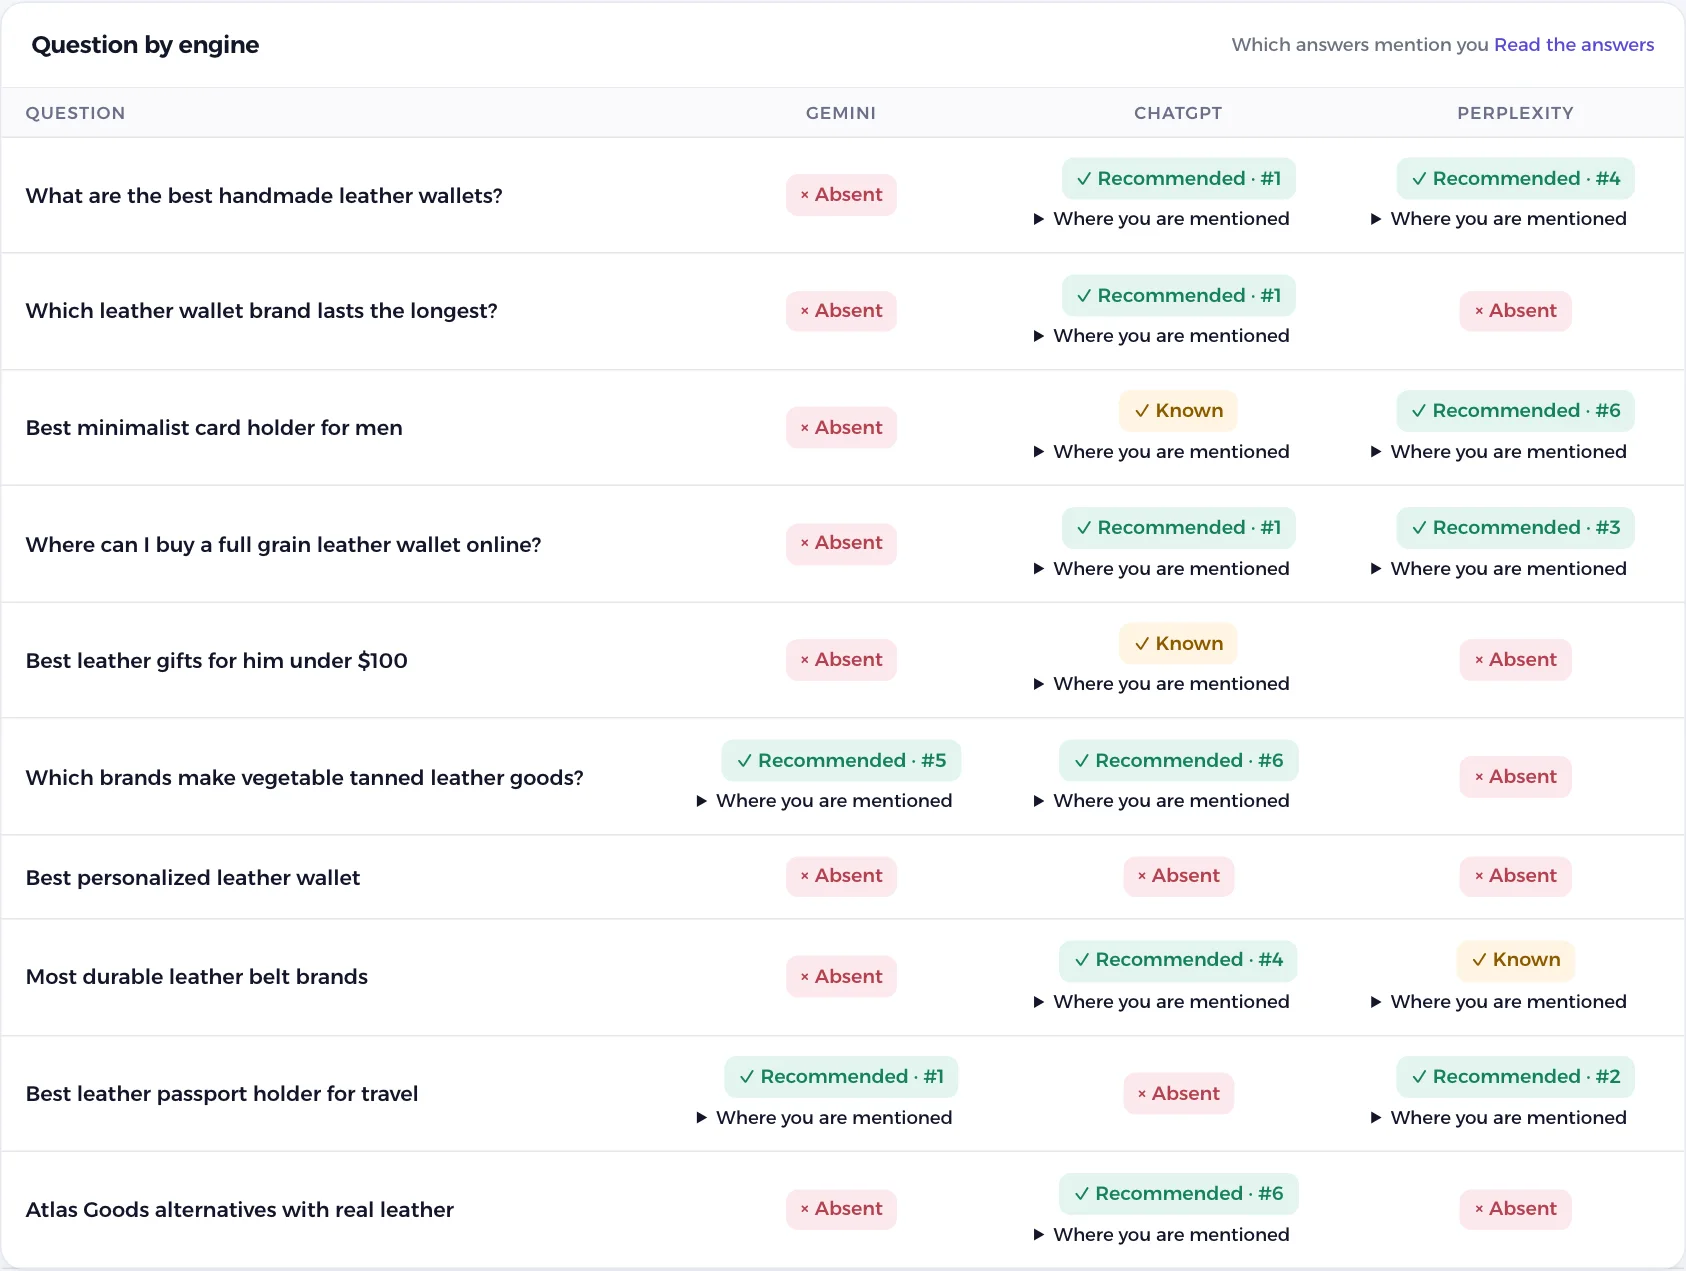
The questions page shows how many engines named the brand on each question: 2/3, 1/3 or 0/3. In the dashboard the same table opens engine by engine and shows the sentence where your brand appears.
What does the report tell you to do?
"List pages to get onto" lists the pages the answers cite where the brand is missing, with the competitors named on each. An action plan for each page is built in the dashboard.
"Site and SEO health" summarises the crawl: a site health score, the problems to fix first and what to do for each.
"Speed and AI bot access" shows mobile and desktop speed and which bots can read the site.
"To-do list" gathers the jobs into one list; finished jobs show the measurement before and after.
"Questions tracked daily" shows the latest daily result for the questions marked as most important.
The method note on the last page says: each question is asked to each AI engine with web search on, a mention counts when the answer names your brand, results change over time and between runs, and no ranking is guaranteed.
How do you share the report?
- Present: opens full screen in the dashboard, arrow keys to move.
- PDF: with the download button. The sample on this page is the output of that button.
- Share link: on Growth and above, a read-only link that needs no account.
- Weekly email: a summary email after every measurement.
- On Pro the report carries your own logo; on Agency your logo, company name and colour.